Parameters
Writing queries with parameters
Parameters allow you to write dynamic queries which make charts and dashboards adjustable by their viewers. This feature is built on top of DucksDB’s named parameters.
Example:
You connect your app’s production users table to Summer and want to create a query for your Customer Success team to look up details of customers they are helping.

This creates a parameter, $user_id, that will filter the query’s results based on the id column. You can give your parameter a display name of “Enter a User ID:” and a type of “Text”, assuming your id column is VARCHAR type.
Your CS team can now enter the user ID of the customer they’re working with and all the query results will update to only display info on that customer.
When you add a parameter to a query, it appears in the parameter toolbar above the SQL editor. In the toolbar, you can view all parameters used in a query, set their default values, and adjust their types as needed.
Important notes:
- Parameter names can only include alphanumeric characters and underscores. For example;
$id,$start_date,$_limit - Each parameter requires a type to be configured which determines the input expected, i.e. text, number, date or drop down.
Parameters on dashboards
When a dashboard includes parameter backed queries/charts, those parameters will automatically appear at the top of the dashboard in the parameters toolbar. This allows viewers of the dashboard to change values for each parameter and all charts linked to those parameters will update accordingly.
Dashboard Editors can control how each parameter behaves in the Parameters section of the Edit Board menu. Functionality includes:
- Setting display names – Give parameters viewer-friendly names to display in the parameters toolbar (example; start_date “Start Date”)
- Setting default values – Override the default value of a parameter for that dashboard specifically
- Hide parameters – Keep parameters from showing in the parameters toolbar while still using the default value for them in charts
- Merge parameters – Combine parameters from different queries into a single dashboard parameter that controls multiple charts
Parameter Merging
Parameter merging is a powerful feature of dashboards. Building on the example above, let’s add another query:

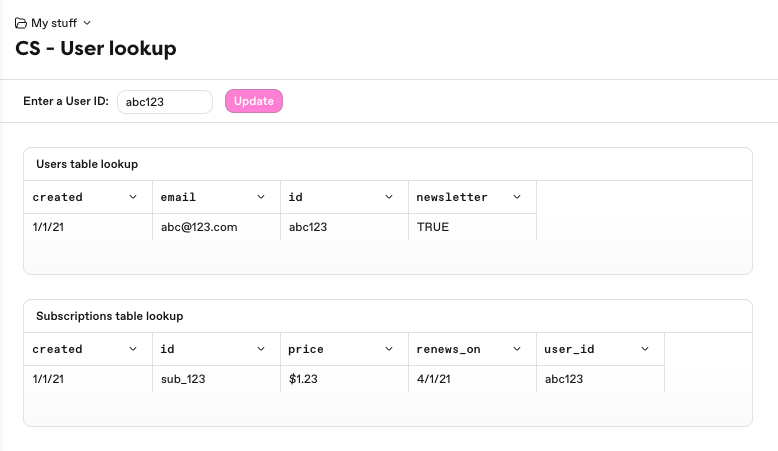
We want to provide our Customer Success team details about the customer from the production users table, and info about their billing relationship from our subscriptions table. In each query, we will build a table chart to use in our Customer Success dashboard.
Each query uses a parameter —$user_id and $u_id– for the same purpose, to filter the query results to the specific customer’s user ID.
Now, we create a Customer Success dashboard and add the table charts from each query to it. As soon as we do that, the parameters toolbar will update to include inputs for $user_id and $u_id.

We could leave this as is and have those inputs operate independently on each chart, but that would require our CS team to input two values. What we want is a single input where they can enter the customer’s user ID and all the charts update. This is where parameter merging comes into play.

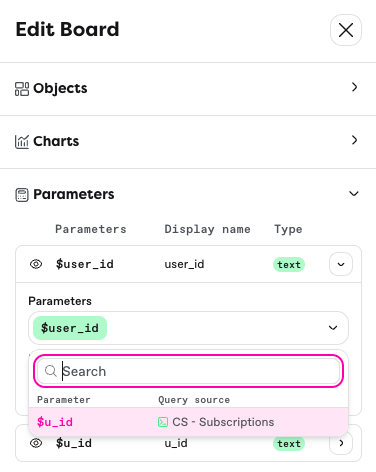
In the Parameters section of the Edit Board menu we can see both parameters. From there we can open $user_id. In the Parameters dropdown, select $u_id. This will merge $u_id into $user_id. You can customize the display name and both parameters will be wrapped into the single parameter in the parameter toolbar under that one display name.

This is a simplified example but it illustrates how powerful parameter merging can be for creating dynamic dashboards.